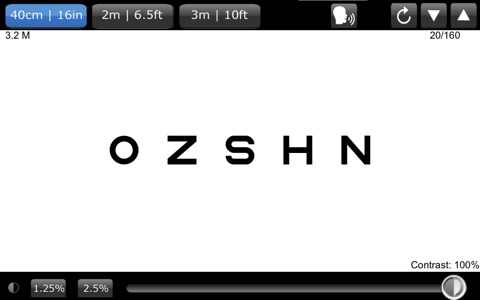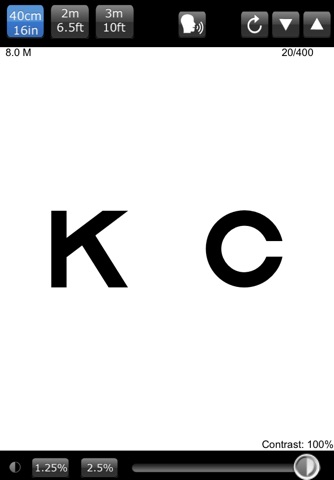
Variable Contrast Sensitivity
This app is not yet compatible with the iPhone 6+ and iPhone 7+
Introduction
The iPad Variable Contrast Acuity Charts are used to test visual acuity and contrast sensitivity. Testing is done in a logarithmic progression. This progression results in every three rows representing a halving or doubling of visual acuity levels. This allows for better interpretation of the significance of noted visual acuity changes because a three line difference in the higher acuity ranges would represent the same degree of change as a three line difference in the lower acuity ranges. Also, the separation between optotypes between rows of optotypes has been standardized to be proportional to the size of the optotypes. This results in smaller spacing in the higher visual acuity levels, and wider spacing in the lower visual acuity levels. This method of visual acuity testing was based on the Early Treatment of Diabetic Retinopathy Study Distance Visual Acuity Chart.
Significant loss of contrast sensitivity is common among low vision patients. Advanced diabetic retinopathy, glaucoma, and neurological disease is strongly associated with significantly reduced contrast sensitivity.
Contrast refers to the darkness of the object compared to the lightness of the background. The highest quality print may have 85 to 95% contrast. US paper currency is printed with 55 to 60% contrast. A gray car approaching an intersection on a shaded street has approximately a 30% contrast, whereas a dark car on a sunny street may have approximately 80% contrast.
Uniqueness of the iPad Variable Contrast Acuity Charts
Whereas conventional eye charts test visual acuity at one level of contrast, the iPad Contrast Sensitivity Eye Charts can measure visual acuity at 100% contrast (the highest contrast) to 1.25% contrast (the lowest contrast). Also, visual acuity can be tested at three different distances; 40 cm (16 inches), 2 meters (6.5 feet), and 3 meters (10 feet) whereas most conventional eye charts can be used only one distance.
The iPad Variable Contrast Acuity Charts ease-of-use allows for assessment of contrast sensitivity without requiring a separate visit and lengthy testing with separate charts. Visual acuity is designated in Snellen equivalents as well as Meter Units (M System).


